3 graphs you need to see if you are selling your Costa del Sol property
Saturday, March 4, 2017 @ 9:54 AM
Always on the lookout for possible trends! And trend changes.
I have been looking at price data for Costa del Sol properties lately to confirm or reject the rising trend of 2016. I then realised that I could get an advance hint of the possible future price behaviour by looking at the supply side. As we know, the price is a function of supply and demand. As we have seen on previous posts, the demand has been steadily rising from Scandinavia, France and Germany, even though it has clearly dropped from the UK. Overall sales have increased. By looking at how the number of properties has changed with time, we can try to identify any trends to get a feel of probable future price movement.
I will simply put the graphs and datatabes here first and analyse them below.
Number of villas on the market in Costa del Sol:
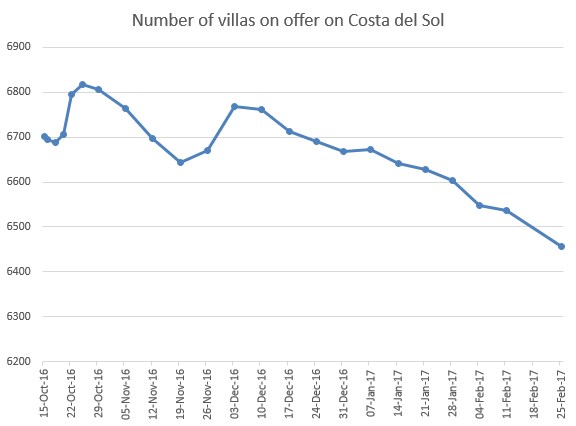
| Date |
Number of villas |
| 15-Oct-16 |
6702 |
| 19-Nov-16 |
6644 |
| 17-Dec-16 |
6712 |
| 14-Jan-17 |
6641 |
| 11-Feb-17 |
6536 |
Number of townhouses on the market in Costa del Sol:
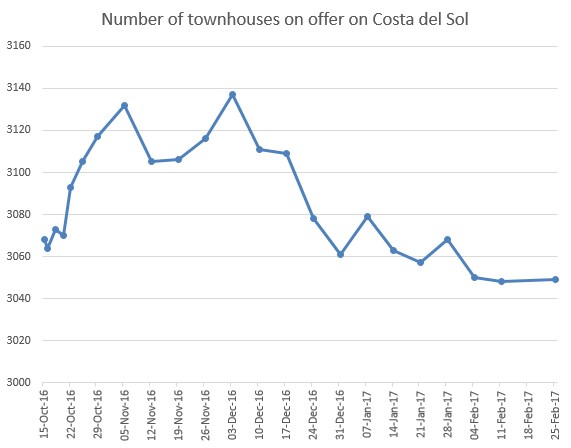
| Date |
Number of townhouses |
| 15-Oct-16 |
3068 |
| 19-Nov-16 |
3106 |
| 17-Dec-16 |
3109 |
| 14-Jan-17 |
3063 |
| 11-Feb-17 |
3048 |
Number of apartments on the market in Costa del Sol:
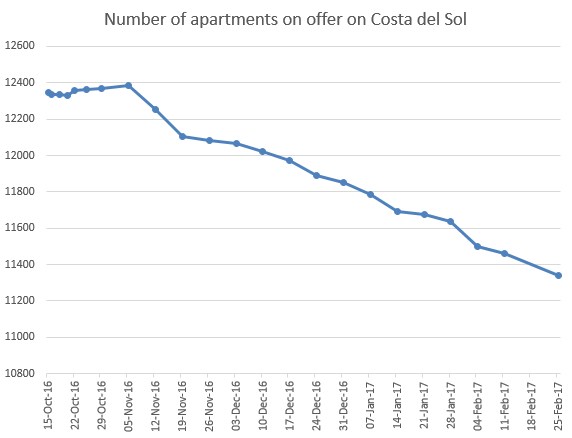
| Date |
Number of villas |
| 15-Oct-16 |
6702 |
| 19-Nov-16 |
6644 |
| 17-Dec-16 |
6712 |
| 14-Jan-17 |
6641 |
| 11-Feb-17 |
6536 |
I hope you can agree that there is a clear downward trend in the number of all three types of properties in the market since 2016. I would assert that, given the fact that sales have not decreased and in fact have risen, the price is likely to go up as supply of available properties in the market goes down. Obviously this would bring more properties in the market as more owners are motivated, but the point is to show that we may be witnessing the beginnings of a new dynamic in the market. Coupled with my previous post on how many of price changes are currently increases rather than decreases, this indicates to me that the probabilities of increased property prices are higher.
For more details and further confirmation you can check out our graphs on our website, the trend is similar accross the board, from Sierra Blanca villas to Marbella apartments.
Looking forward to your comments, I hope you enjoyed this post.