Property prices in the whole of Spain have continued to rise, but at a much slower pace.
Property sale data for full year 2018 and January 2019 have been published by INE, the Spanish statistics institute. Firstly, the comparison of 4th quarter 2018 to 4th quarter 2017, where the increase in prices on average was 6.6%:
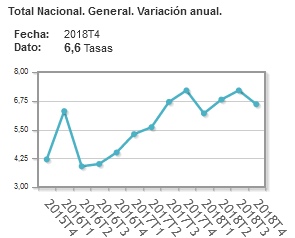
Broken down by type, newly constructed properties have risen by 8.0% in price and resale properties by 6.4% compared to 4th quarter of 2017. We see that the prices are still rising, since the number is a positive one, however at a slightly slower pace compared to earlier quarters of 2018.
The slower rate of price increase is more evident when compared to the previous quarter, i.e. 3rd Q of 2018, where we see the value barely in positive territory, at 0.4%:
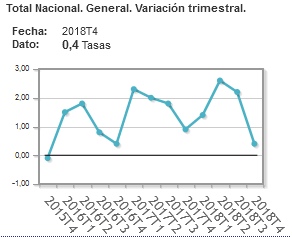
What does that tell us? As you can see in the graph above, there is a strong seasonal effect: every 4th quarter (marked with T4) sees a drop to the lowest rate of price increase (if still positive as in this case) for the year. So this latest drop is not in itself meaningful. We expect a spike up again for the first trimester of 2019 – if this materialises, then we know that the 4th quarter 2018 deceleration was once again the seasonal effect.
The table below summarises the data:
|
|
|
Quarterly variation
|
Annual variation
|
|
Average index
|
|
0.4
|
6.6
|
|
New construction
|
|
1.2
|
8
|
|
Resale properties
|
|
0.3
|
6.4
|
For a peek into the possible values of the first trimester 2019 we can look at the just released data for number of properties sold in January 2019:
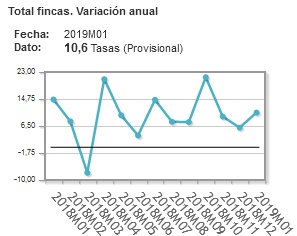
Compared to the number of properties sold in January 2018, we see that we now have 10.6% more properties sold. And from the graph above we can see that the rate is picking up compared to the 6.5 of the month prior.
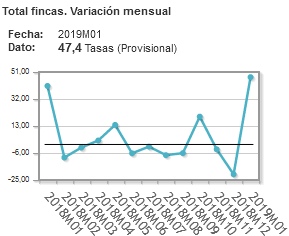
The total purchase operations for January 2019 were 198,298, a whopping 47.4% increase compared to January 2018! A data point that bodes well for the expected “spike” mentioned earlier.
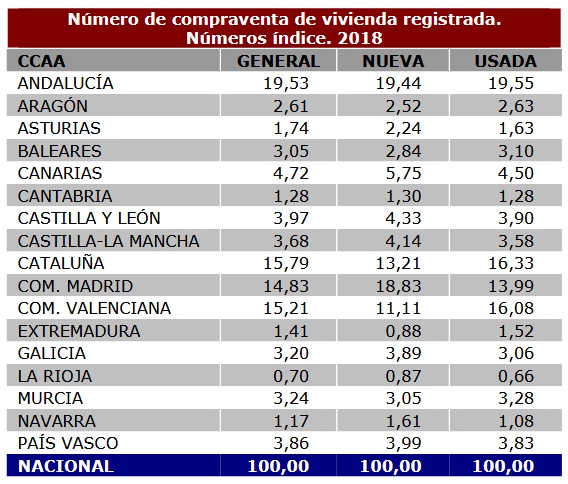
Remember, this data is for the whole of Spain. The table and map below shows the breakdown by region, where you can see the Andalucia region continues with intense activity, being the region with the highest number of properties sold in 2018:
Property transactions grouped by autonomous region – Year 2018
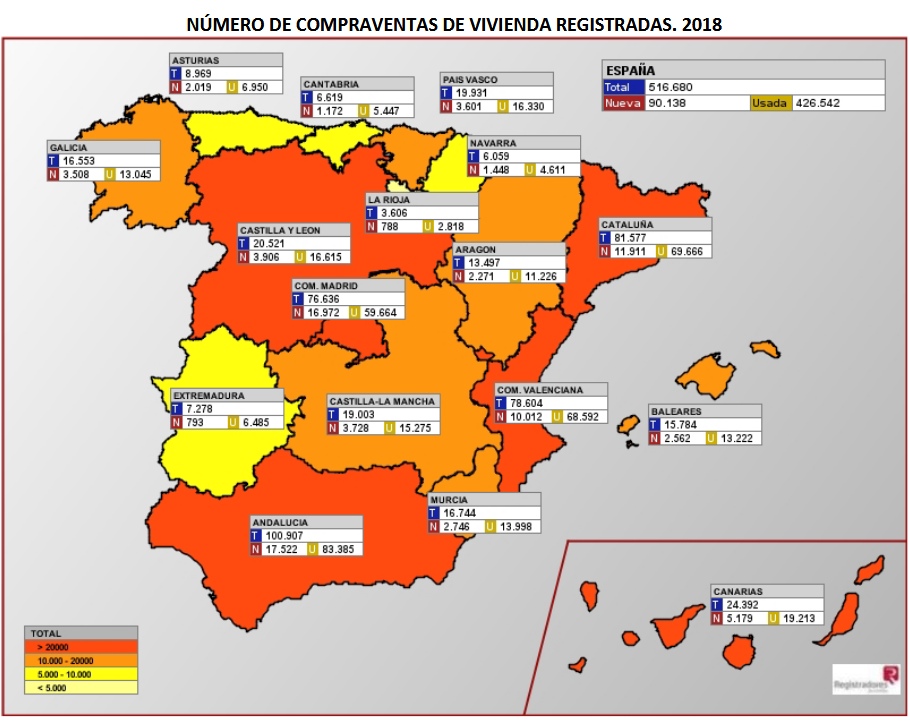
Worthy of note is the fact that 17% of the sales are for newly constructed properties (first occupancy). This has been approximately steady between 17-18% throughout the year 2018.
In coclusion, we would like to see this trend continuing positively. The cooler pace is a welcome development as it would mean a more sustainable market environment, the interest rates remain low, and the increase in January 2019 activity bodes well for the first trimester of 2019.
Thanks for reading and please contact us if you have any questions, or visit our Costa del Sol properties website for more statistics: hbcostadelsolproperties.com
For a podcast version of this article please download this MP3 file: https://hbcostadelsolproperties.com/hbcmarketreport.mp3